Live Dispatch — 05:14 AM
17 routes active · 312 stops · 6 drivers en route
Fleet utilization
87%
Route Optimizer v3.2·Metro Region · 4 active routes

Every mile is
someone's meal.

Route replaces the whiteboard. Built for food banks, disaster relief convoys, and mobile health clinics — where a wrong turn doesn't waste gas, it wastes lives.

Simulate Your Routes FreeNo account · No card · Instant results
Route 4 — ACTIVE
23 stops · 41.2 mi · 2h 14m
Today's Dispatch — All Routes
Fleet Total
Total Miles
161.4 mi
Households
792
Fuel Cost
$46.50
Drive Hours
8h 59m
Route Optimized

Saved 23.1 mi vs. manual routing · 4 fewer driver-hours · 61 more households served

01 — WASTE
31%

of delivery capacity is lost to redundant routing at the average regional nonprofit.

That's not a rounding error. At a 40-van fleet running 5 days a week, that's the equivalent of 12 vans sitting in the parking lot while thousands of households wait.

31%
Delivery capacity lost to redundant routing
Industry average across 140 regional food banks surveyed
4.2h
Weekly planning time per coordinator
Spent on spreadsheets instead of program delivery
19%
Routes overlap on average metro fleet
Two drivers covering the same block, neither knowing it
Redundant Routes
Two vans visiting the same block on the same day. Neither driver knows.
Dead Miles
Repositioning without stops. Fuel burning, clock running, no one served.
Missed Stops
Households skipped because the route ran long. No alert. No recovery.
Planning Drag
Hours per week rebuilding the same routes from scratch in Excel.

"I had three drivers covering the same zip code on Tuesday. I didn't find out until Friday when one of them mentioned it."

— Operations Director, Mid-Atlantic Food Bank · 44-van fleet
02 — COST
$31k

in recoverable waste per year, for a fleet of 40 vans.

That's not operating budget — that's donor money. Every dollar lost to routing inefficiency is a dollar that could have bought another pallet of food, stocked another mobile clinic, or funded another disaster response vehicle.

What $31,460 buys instead
🥫
94,380 meals
at $0.33/meal average
🚐
1 additional delivery van
fully equipped
👩‍⚕️
628 mobile clinic visits
at $50/patient average
📦
2,097 emergency supply boxes
disaster relief standard
Weekly Cost Audit — 40-Van Fleet
Line ItemWeeklyAnnual
Redundant miles (avg. 19%)$284$14,768
Coordinator planning hours$156$8,112
Missed delivery re-routes$98$5,096
Vehicle wear (excess idle)$67$3,484
TOTAL RECOVERABLE COST$605$31,460
* Based on national average fuel cost $3.85/gal, $0.21/mi operating cost, coordinator at $28/hr. Fleet size 40 vans, 250 operating days/year.
See your actual number

Paste your address list. Route calculates your specific waste in under 60 seconds.

Simulate Your Routes Free
03 — TIME
3sec

to generate optimized routes for a 200-stop fleet. Your coordinator was spending 4 hours doing this manually.

Time Recovered Per Role — Weekly
Operations Director
Route planning eliminated
Before
4.2h/week
After
0.4h/week
Saved
3.8h
Volunteer Coordinator
Driver briefing automated
Before
2.8h/week
After
0.3h/week
Saved
2.5h
Driver (avg.)
Turn-by-turn on device
Before
22 min/day
After
0 min/day
Saved
22 min
Grant Manager
Impact data auto-generated
Before
3.1h/report
After
8 min/report
Saved
2.9h
How Route Works
01
Upload Addresses
Paste a CSV or drop pins on the map. No formatting required.
02
Set Constraints
Time windows, vehicle capacity, driver availability, priority stops.
03
Route Generated
Optimized routes appear in under 3 seconds for fleets up to 200 stops.
04
Push to Drivers
Turn-by-turn directly to any phone. No app install required.
Route Simulator — Free Trial
No account required
Simulate Your Routes Free
No accountNo credit cardResults in 60 seconds
04 — PROOF
340+

nonprofits replaced their spreadsheets with Route. Here's what happened next.

340+
Nonprofits using Route
Active as of Q1 2026
2.1M
Households served via Route
Cumulative, 2023–2026
18.4M
Miles optimized
Verified GPS data
$4.2M
In fuel waste recovered
Across all fleets
From the field
38% fuel reduction

"We went from 4 hours of route planning every Sunday night to clicking a button on Monday morning. Route found overlaps we'd had for three years."
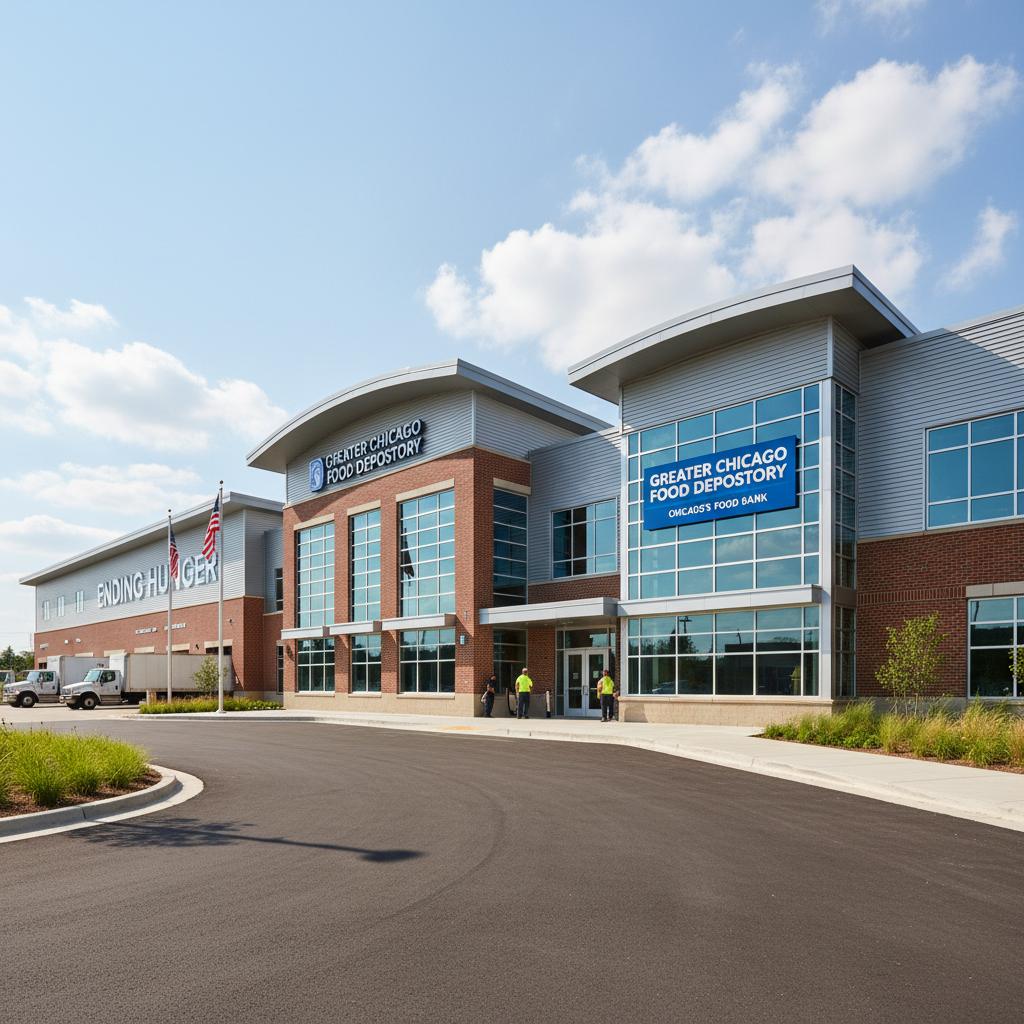
Denise Okafor, Operations Director at Greater Chicago Food Depository
Denise Okafor
Operations Director · Greater Chicago Food Depository
47 vans
91% grant approval rate

"Our grant reports used to take three days. Route generates the impact data automatically — miles per household, cost per delivery, everything our funders ask for."
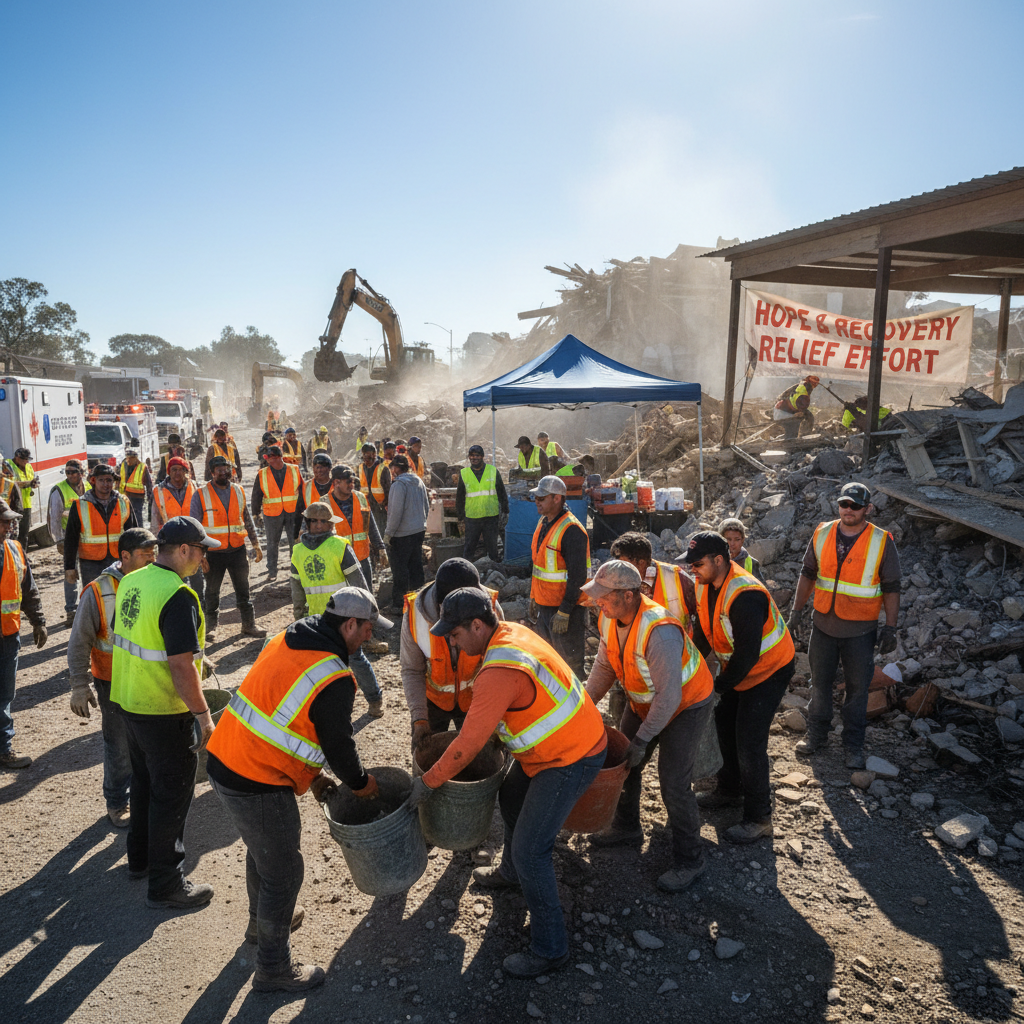
Marcus Tran, Program Manager at Houston Disaster Relief Coalition
Marcus Tran
Program Manager · Houston Disaster Relief Coalition
22 vans
61 more households/week

"We serve 14 counties with volunteer drivers who've never been to half these neighborhoods. Route's turn-by-turn eliminated wrong turns almost entirely."
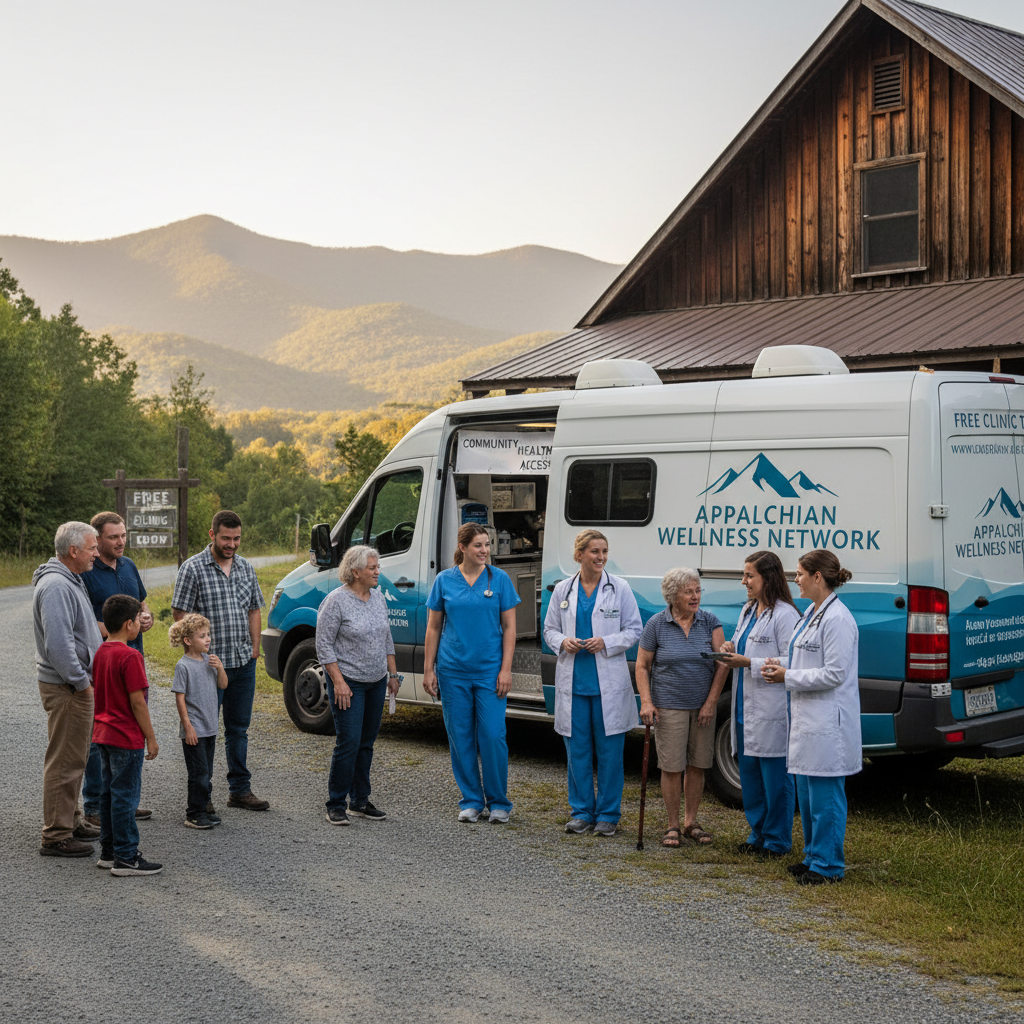
Priya Krishnamurthy, Volunteer Coordinator at Rural Health Access Network, Appalachia
Priya Krishnamurthy
Volunteer Coordinator · Rural Health Access Network, Appalachia
31 vans
$180k grant secured

"I showed the board our Route dashboard at the last meeting. They saw real-time cost-per-household data. We got our largest operational grant three weeks later."
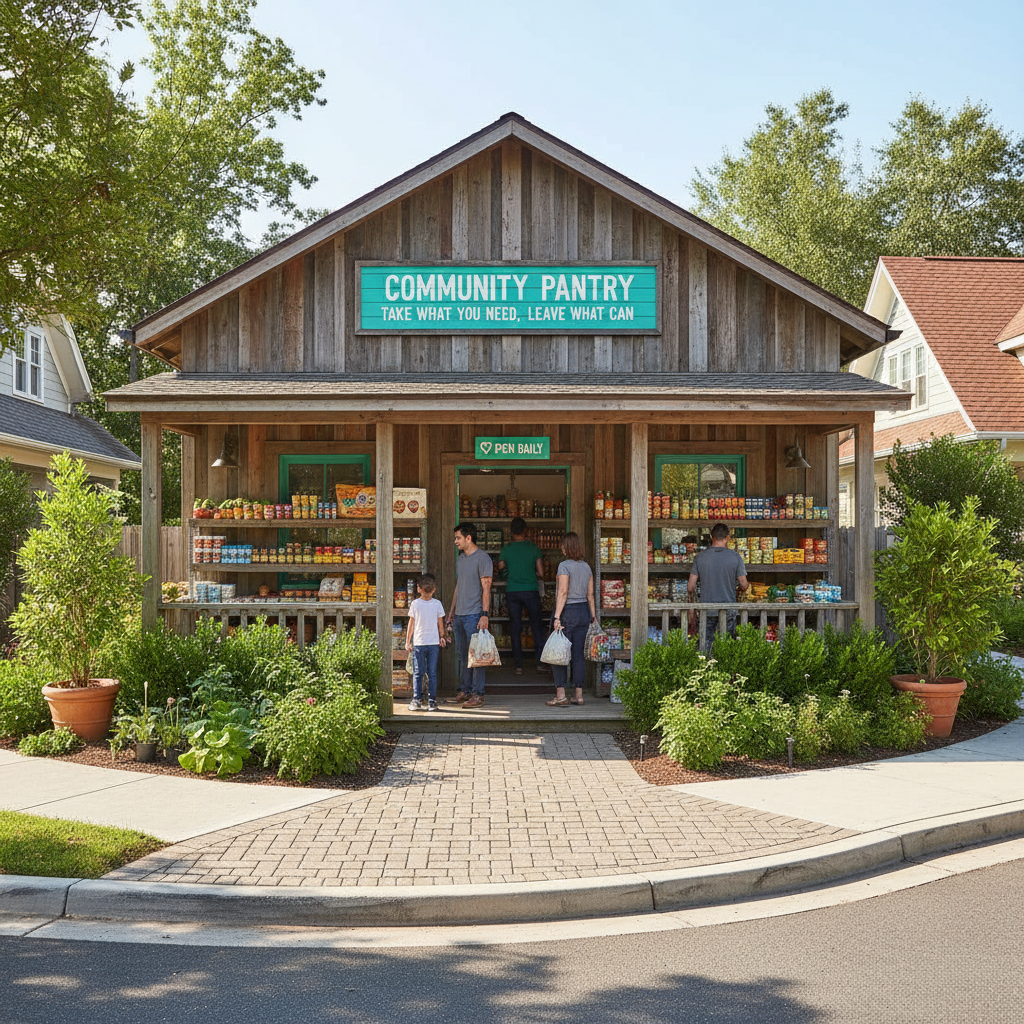
James Whitfield, Executive Director at Pacific Northwest Community Pantry
James Whitfield
Executive Director · Pacific Northwest Community Pantry
19 vans
38% fuel reduction

"We went from 4 hours of route planning every Sunday night to clicking a button on Monday morning. Route found overlaps we'd had for three years."

Denise Okafor, Operations Director at Greater Chicago Food Depository
Denise Okafor
Operations Director · Greater Chicago Food Depository
47 vans
91% grant approval rate

"Our grant reports used to take three days. Route generates the impact data automatically — miles per household, cost per delivery, everything our funders ask for."

Marcus Tran, Program Manager at Houston Disaster Relief Coalition
Marcus Tran
Program Manager · Houston Disaster Relief Coalition
22 vans
61 more households/week

"We serve 14 counties with volunteer drivers who've never been to half these neighborhoods. Route's turn-by-turn eliminated wrong turns almost entirely."

Priya Krishnamurthy, Volunteer Coordinator at Rural Health Access Network, Appalachia
Priya Krishnamurthy
Volunteer Coordinator · Rural Health Access Network, Appalachia
31 vans
$180k grant secured

"I showed the board our Route dashboard at the last meeting. They saw real-time cost-per-household data. We got our largest operational grant three weeks later."

James Whitfield, Executive Director at Pacific Northwest Community Pantry
James Whitfield
Executive Director · Pacific Northwest Community Pantry
19 vans
For Grant Managers

Prove every donated mile was optimized.

Route auto-generates impact reports with GPS-verified data: cost-per-household, miles-per-delivery, fuel efficiency vs. manual baseline. Export as PDF or share a live link.

Cost-per-household by route and date range
Fuel efficiency vs. unoptimized baseline
Total households served with GPS verification
Volunteer hour equivalency calculations
Sample Impact Report
Reporting PeriodQ4 2025 · Oct–Dec
Total Deliveries4,847 households
Miles Driven12,340 mi (GPS verified)
vs. Unoptimized Baseline−31.2% (−3,862 mi)
Fuel Cost$3,561 ($742 saved)
Cost Per Household$0.73 (down from $1.06)
05 — SWITCH
Day 1.

Most orgs are fully switched from spreadsheets on their first dispatch day. Here's why the switch is irreversible.

FeatureSpreadsheetRoute
Route planning time3–5 hours/week< 1 minute
Optimization accuracyHuman estimateTSP-optimized
Driver directionsVerbal briefingTurn-by-turn, any device
Real-time changesPhone callsPush update in 1 click
Impact reportingManual calculationAuto-generated PDF
Grant documentationDays of workGPS-verified, instant
Fleet of 40+ vans❌ Breaks down✓ Built for it
Cost$0 (but $31k/yr waste)From $149/month
Common Questions
No. Route sends a link via SMS. Drivers tap it and get turn-by-turn navigation in their phone's browser — no download, no login.
Yes. Route accepts CSV, Excel, Google Sheets, or manual pin-drop. Any address format works. We have a one-click import from most donor management systems.
One click re-optimizes around the new stop and pushes updated directions to the driver instantly.
Yes — this is one of the most common use cases. Turn-by-turn directions work on any device, and coordinators can see all drivers on a live map.
We offer a nonprofit rate — typically 40% below commercial pricing. Starts at $149/month for up to 10 vehicles. Volume pricing available. We've never charged a food bank to use basic route simulation.
Replace the whiteboard. Today.

See what Route does
with your routes.

Paste your address list. No account. No credit card. Route shows you the optimized version, your estimated savings, and a full impact report — in under 60 seconds.

Free simulation for any fleet size
Nonprofit pricing from $149/month
Full onboarding in under 2 hours
30-day money-back guarantee
Trusted by nonprofits across the country
Greater Chicago Food DepositoryHouston Disaster Relief CoalitionRural Health Access NetworkPacific Northwest Community PantryAtlanta Mobile Health InitiativeNYC Emergency Food Response